Only EnergyReports™ gives you the complete picture!
Your success in balancing energy use with comfort, and achieving sustainable building operations, depends upon your access to critical building information. With EnergyReports, you’ll get all the information you need.

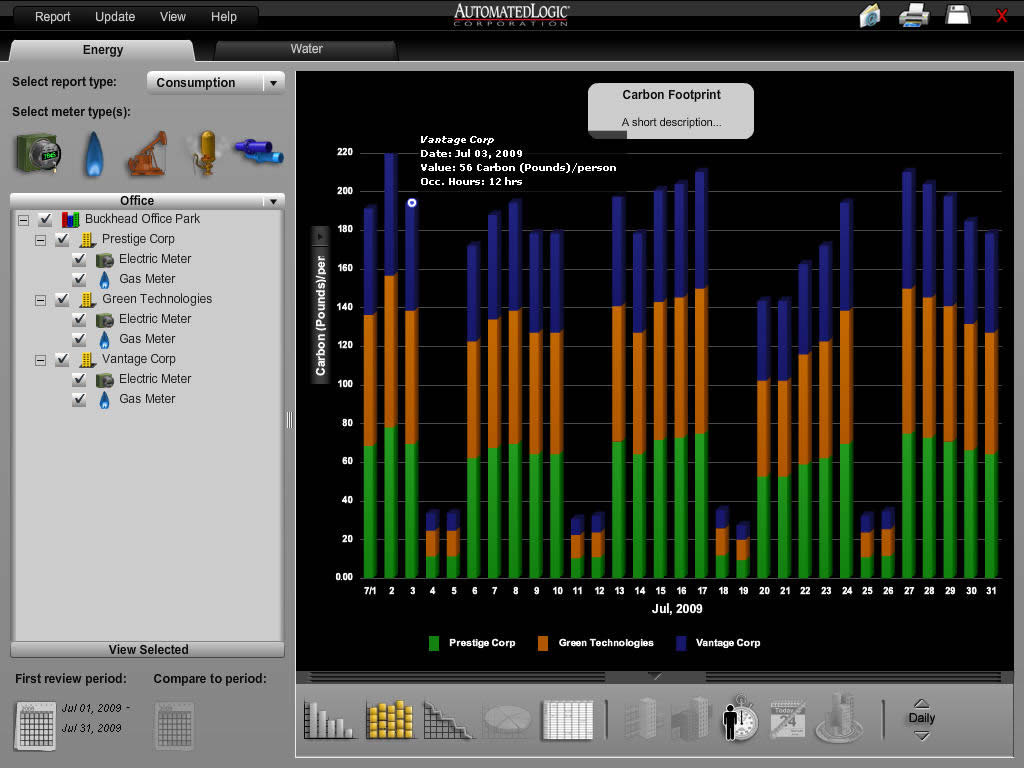
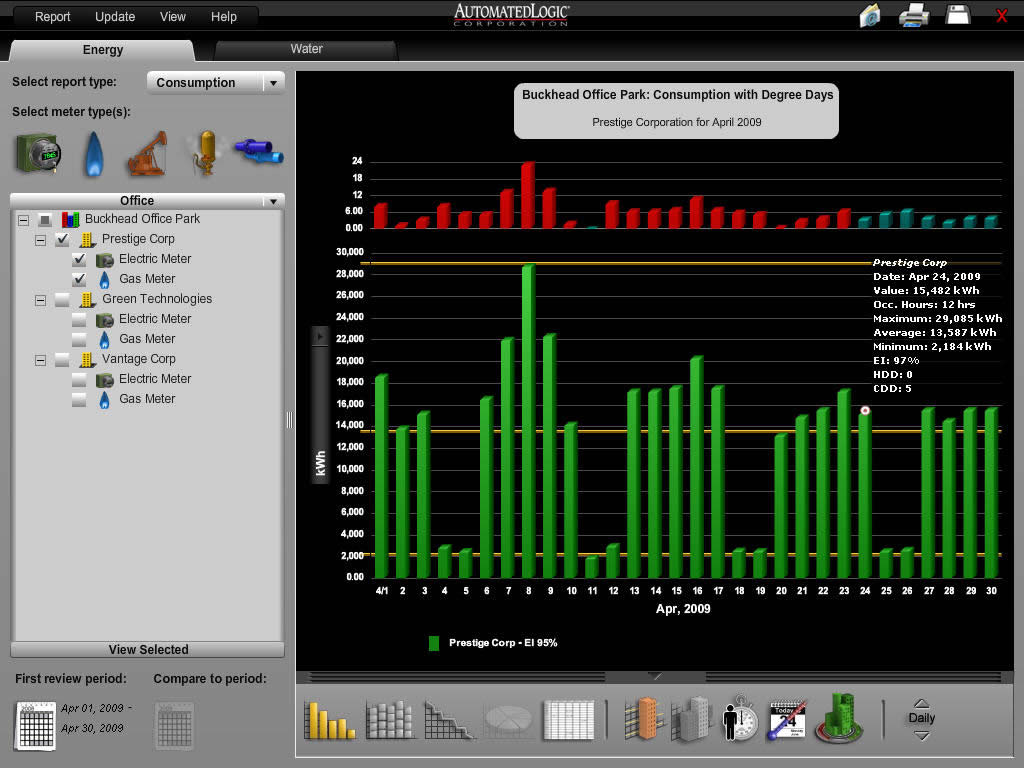
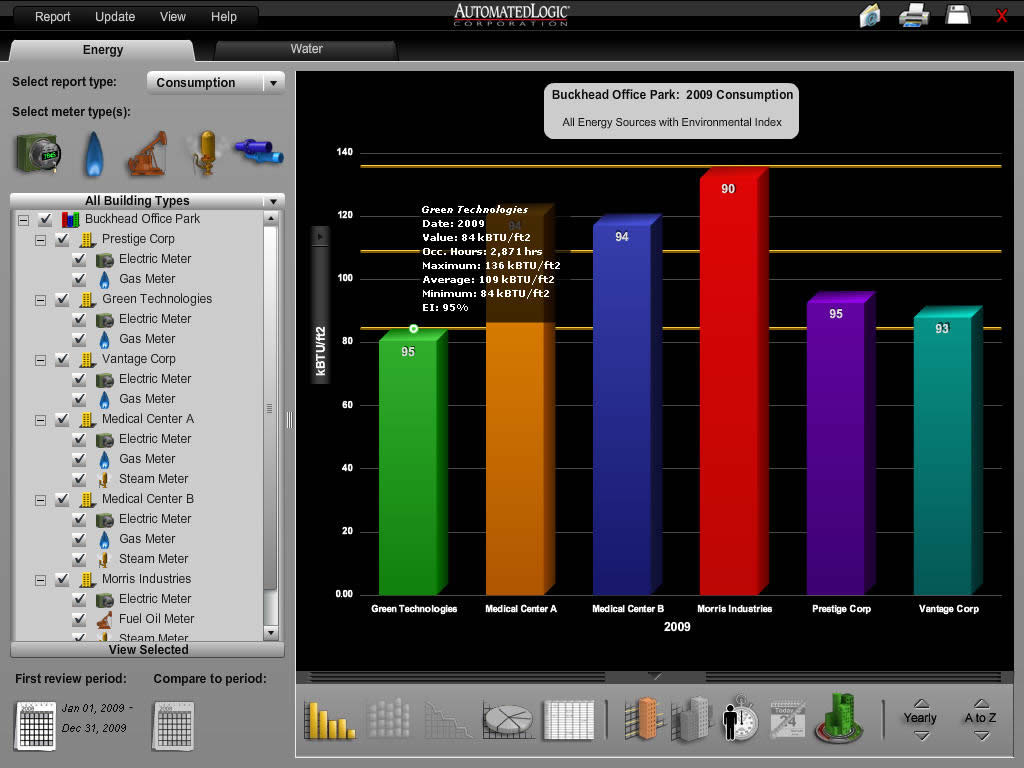
Versatile and easy to use, EnergyReports generates data on the fly or automatically sends it in the format you specify. Leveraging WebCTRL’s extensive and scalable trending capabilities*, it provides a fully integrated solution, easily installed and deployed. And unlike any other management tool, EnergyReports can display the Environmental Index alongside energy usage data for a graphic comparison of efficiency and comfort. Accessed through a standard browser, EnergyReports offers a variety of colorful graphical formats as well as spreadsheet-style data. Reports include occupied/ unoccupied usage, Cooling Degree Days (CDD), Heating Degree Days (HDD), low median- high data and benchmark comparison data. Users can normalize consumption information or convert it to other units including cost and CO2 emissions. An integrated Report Manager function can automatically schedule, send and archive monthly, quarterly or yearly reports in Excel® spreadsheet or Acrobat® PDF formats.
* Requires WebCTRLv4 or later software
analytics edition
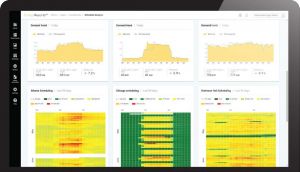
The EnergyReports™ Analytics Edition helps you make faster, data-driven building energy management decisions by providing advanced analytics, machine learning, and actionable insights to reduce costs, save time, and forecast and track performance. The EnergyReports Analytics Edition builds upon the EnergyReports Dashboards Edition by adding several key analysis and visualization capabilities for advanced energy management across your building portfolio.

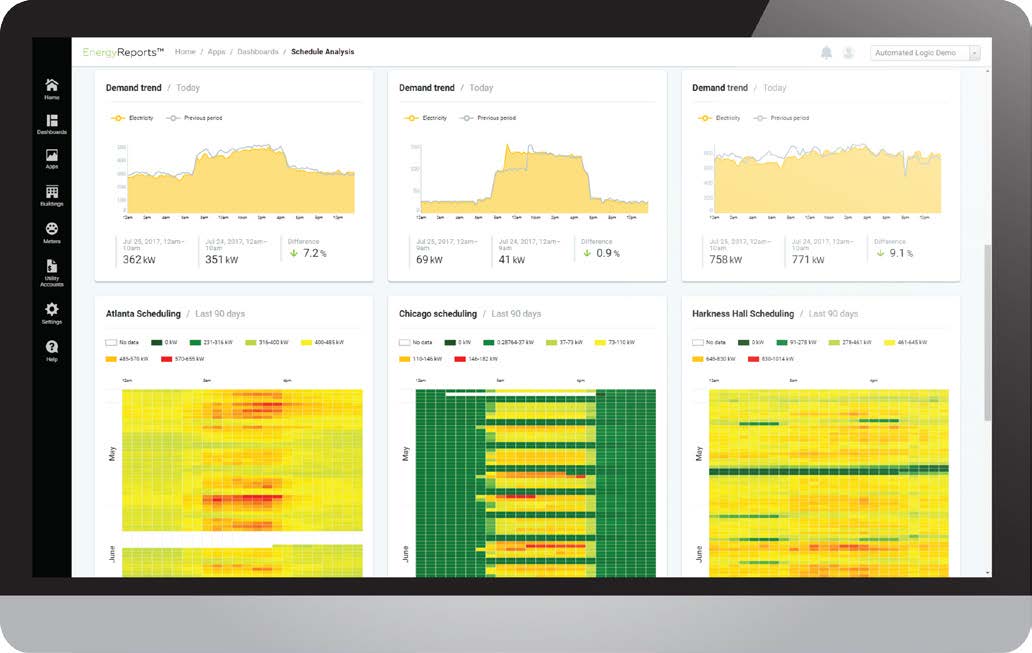
Find savings in scheduling, peak-demand, and drift inefficiencies:
- Minimize peak demand charges by staying on top of load profile and trending analysis to eliminate offending events.
- Identify scheduling inefficiencies with heat maps, or fluctuating building energy trends with drift maps, created with real-time data.
- Dig deep into the performance of a single building or across your aggregated portfolio.
- Share your reports and insights easily with others through shared dashboards, scheduled emails, and data exports.
dashboard edition
The EnergyReports™ Dashboards Edition leverages the WebCTRL® building automation system to deliver a 360-degree view of building performance so stakeholders can meet their energy conservation and savings objectives.

Building upon the EnergyReports EcoScreen Edition, the EnergyReports Dashboards Edition allows operators to create graphs, charts, reports and dashboards to visualize building data, enabling them to:
- Convert energy consumption data to cost or CO2
- Benchmark energy performance data against ENERGY STAR® scores
- Analyze and normalize energy consumption across buildings
- Identify performance issues to help maximize building efficiency
- Review portfolio wide, year-over-year energy costs
- Gain insights that help drive energy conservation measures
- Create your own energy dashboards using our simple drag-and-drop tools to analyze and share your data in unique ways
- Simplify utility reporting and distribute reports across departments with shared data with key stakeholders
- Bring data to life with interactive and intuitive visualizations that provide value to anyone in the organization
- Visualize trends over time, understand what is driving your costs, and verify the accuracy of your monthly bills
- Manage data collection of utility bills for analysis
Eco-Screen® edition
The EnergyReports™ Eco-Screen® Edition allows you to engage building occupants by showcasing your building’s energy conservation and sustainability measures. It’s an innovative way to bring your building to life, making its behind-the-scenes workings, both engaging and interactive.
Designed for a non-technical audience, the EnergyReports Eco-Screen Edition retrieves information from the WebCTRL® building automation system and other sub-metered and renewable generation systems and makes it accessible to those who impact building performance the most - building occupants. By increasing awareness of energy efficiency programs and sustainability initiatives in your facility, people and teams across your organization are encouraged to collaborate around shared sustainability goals.

- Delivers interactive and dynamic displays of building data that can be shared across the organization
- Educates building occupants about sustainability goals and progress to drive occupant awareness and action
- Supports display on a public touchscreen, company intranet, or mobile device
- Engages facility occupants in energy and water use reduction competitions by tracking real-time usage and cumulative year-over-year savings on interactive dashboards
view WebCTRL® view Eikon® Logic view hardware